


Dietary Assessment of Pregnant Teenagers in Tamale Metropolis
University for Development of Studies, Community Nutrition, Tamale/Northern Region, Gana
Keywords: Adölesan, Gebe Adölesan, Beslenme Durumu, Diyet Değerlendirme, Teenager, Pregnant Teenager, Nutritional Status, Dietary Assessment
5,973 views 3,548 downloads
Gereç ve Yöntem: Bu kesitsel çalışma Tamale Metropoliste 294 gebede gıda alımını ve gıda kalitesini değerlendirmek için sırasıyla Gıda Tüketimi Skorları (GTS) ve Diyet Çeşitlilik Skorları (DÇS) kullanılarak tasarlanmıştır.
Bulgular: Adölesanların yaklaşık yarısında (%51.7) ortalama GTS (42.95) FAO/WFP eşik değerine göre DÇSden (35) daha kabul edilebilir düzeyde idi. Ortalama Bireysel Diyet Çeşitlilik Skoru (BDÇS) (10) ise oldukça yüksek diyet kalitesi gösterdi. BDÇSnin, bakıcıların cinsiyeti, mesleği ve adölesana olan yakınlığı gibi sosyo-demografik faktörlerle önemli derecede ilişkili olduğu gözlendi.
Sonuç: Bu bulgular gebelik sırasında ve sonrasında beslenme durumunun iyileştirilmesi ve korunmasında, adölesan gebelerin diyet alımı artırmak için yapılan programları ve politikaları tasarlarken adölesan gebelerin bakıcıları veya eşlerinin de dikkate alınması gerektiği ihtiyacını vurgulamaktadır.
Material and Method: A cross sectional survey of 294 pregnant teenagers in Tamale Metropolis was designed to assess food intake and food quality using Food Consumption Scores (FCS) and Dietary Diversity Scores (DDS) respectively.
Results: The mean Composite Food Consumption Score (CFCS) was 42.95 with just about half of the teenagers (51.7%) having acceptable levels of food intake based on the FAO/WFP threshold of more than 35 CFCS. The mean Individual Dietary Diversity Score (IDDS) of 10 also showed a considerably high dietary quality. The CFCS was observed to be significantly associated with caretakers socio-demographic factors such as gender, occupation and relationship with the teenager.
Conclusions: These findings highlight the need to consider the caretakers or spouses of pregnant teenagers in designing intervention programs and policies to improve the dietary intake of pregnant teenagers for the improvement and maintenance of their nutritional status during and after pregnancy.
Introduction
The nutritional and health status of a pregnant woman is an important determinant of growth and development of the fetus and child even after birth.
Dietary inadequacies during pregnancy and lack of economic resources contribute to a high neonatal morbidity and low birth weight8 even on provision of an ideal environment and nutritional inputs9. Maternal undernutrition leads to smaller placental size and with fewer cells available for transfer of oxygen and nutrients to the fetus, leads to lower birth weight10. In addition, the risk of having deficiencies of iodine, folic acid and iron, which are essential during pregnancy, has serious consequences for the fetus11.
Monotonous and inadequate diets are known to contribute to the burden of malnutrition and micronutrient deficiencies especially in developing countries12. Despite the many approaches used to combat micronutrient malnutrition in such poor settings the problem remains unabated. However, recommendations around the world have pointed to the use of food-based strategies as a most sustainable way in meeting micronutrient needs13 and especially during pregnancy. Dietary diversification, which is an important component of the food-based approach, is critical in ensuring sustainable diets that allows the population, and especially the vulnerable groups (mainly women in reproductive age and children under five years), meet their nutrient requirements.
In Ghana, the Northern and Central Regions have the highest burden of teenage pregnancies, with about 23% of girls aged 15-19 years who have either had a live birth or are pregnant with their first child as against the national average of 13%14. Generally, there is a disparity between urban teenagers and their rural counterparts; 11% of adolescents in urban areas have begun childbearing, compared with 16 percent of those in rural areas, representing a reduction in the urban-rural gap in teenage childbearing from 7 percent in urban areas and 22 percent in rural areas since 200315. Food and nutrition security vulnerabilities are also very high in the Northern Region of Ghana16 and the effects are borne mostly by the vulnerable poor most of who are teenagers.
Despite the many negative nutritional, health, social, and demographic consequences of teenage pregnancy, sufficient attention has not been paid in the area of scientific research to the socio-cultural and physiological factors that affect the nutritional status of pregnant teenagers, which are critical for successful outcomes of their pregnancies.
An understanding of the determinants of nutritional status among pregnant teenagers in Tamale Metropolis will go a long way to offer opportunities for formulating public health policies that would engender better recognition of the social, clinical and nutritional needs of adolescence especially during pregnancy and childbirth, in order to address them adequately.
This study was therefore aimed at exploring the many factors including dietary, which are critical in determining the nutritional status and birth outcomes of teenagers in the Tamale Metropolis.
Materials and Methods
The design adopted for this study was a cross-sectional one to collect information from pregnant teenagers at one point in time. Pregnant teenagers were selected at the antenatal care centers in 7 suburbs of Tamale Metropolis. These suburbs were Nyohini, Bilpiela, Vitting, Sagnarigu, Choggu, Tamale central and Taha/Kamina. The choice of these centers was made as wide as possible to target both rural and urban teenagers in the Metropolis.
Sampling
The research subjects were recruited purposefully at
the antenatal care centers in the Metropolis. The criterion
for recruitment was based on age of respondents.
Therefore, pregnant women who were in their teens were eligible for recruitment. Ages were obtained from
antenatal attendance cards which were further confirmed
or verified during the interviews.
In the calculation of the sample size, a 10% of the statistically determined minimum value of 274 was added to account for none responses and sample attrition. Thus, a sample size of 299 pregnant teenagers was selected for the study.
Data Collection and Instruments
Data on food intake and socio-demographic characteristics
of respondents as well as socio-demographic
information of respondents' caretakers were obtained
by interviews using semi-structured questionnaires.
Data was also collected on other variables namely;
micronutrient supplementation, gestational ages of
pregnancies and diets/foods intakes from the various
food groups in the population (via a food frequency
questionnaire).
The food lists for drawing out the FFQ was obtained from a 24 h recall of a sample of 20 respondents who met the criteria for recruitment into the study. Those foods that were rarely consumed were removed from the food lists.
Data Analysis and Presentation
The level of food intake was analyzed using the Food
Consumption Scores (FCS) indicator developed by the
FAO and WFP17. Eight different food groups; cereals
and tubers, pulses, vegetables, fruits, meat and fish,
dairy products, sugar and fats and oil were used to
calculate the FCS. This was done by multiplying the
frequency of consumption (in days) by the respective
weights based on their nutrient density to obtain their
consumption scores. The scores for each respondent
were then summed up to obtain a total FCS as in the
formula below. Their levels of food intake were then
categorized using the thresholds provided by FAO.
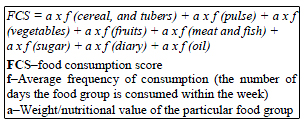
The levels of food intake of the respondents were obtained with the food consumption scores. The score were used to categorize levels of intake as; acceptable, borderline and poor using the WFP/FAO thresholds as shown in the table below18. The frequency of respondents falling under each category was reported.
The dietary diversity of respondents was assessed using the Individual Dietary Diversity Score (IDDS). This score is defined as the total number of food groups consumed by an individual within a reference period (one day or a week). This indicator was used because it has been shown to have a considerably high accuracy in measuring dietary or nutritional adequacy among adolescents19. In line with the FAO guidelines for this indicator, the foods consumed by the respondents were grouped into one of twelve food groups20. These groups are meats, fish, dairy products, eggs, cereals and roots, pulses and nuts, vitamin A rich vegetables, other vegetables, vitamin A rich fruits, other fruits, fats and oils and miscellaneous foods. These foods are grouped based on their nutrient qualities.
These two indicators of diet adequacy and diversity or quality were analyzed together for central tendencies such as means, mode and medians and measures of spread such as standard deviation. The confidence intervals were calculated at 95%. Spearmans correlations and linear regression were also carried out to test the relationship between the FCS and IDDS. The chisquare test was carried out on the categorical variables to establish any associations between food intake and dietary diversity. The data was analyzed using SPSS (version 16.0)
Ethical Approval
This study received prior ethical approval from the
Institutional Review Board of the School of Medicine
and Health Sciences of the University for Development
Studies. Local approval was also sought from each of
the heads of the various health centers visited. Informed
consent was also obtained from each respondent.
Results
The socio-demographic characteristics of the respondents are shown in Table 1 below. Majority of the respondents (71.6%) were nineteen years old whilst a few were under 19 years old. Over half of the respondents (55.3%) had no formal education, very few (5.1%) had just primary education, about a third (31.1%) had JHS education and a few (8.5%) had SHS education. With regards to marital status, majority (64.2%) were married whiles 34.5% were never married. Only a few of the respondents were living with their partners.
Table 1: FAO Thresholds for Food Consumption Scores (FCS)
Socio-Demographic Characteristics of the Caretakers
of Pregnant Teenagers
Majority of the respondents (83.7%) had their caretakers
being males. Most of the caretakers (63.5%) were
between the ages of 26 and 35 years, a large proportion
was married (80.6%) and had no formal education
(70.3%) at all. For those with some form of formal education, majority had the most basic form of formal
education (Table 2).
Table 2: Socio-Demographic Characteristics of the Teenagers and their Caretakers
The Socio-Economic Status of the Caretakers
Most of the caretakers (87.6%) were informally employed
whiles just about 3.4% and 8.3% were formally
employed and unemployed respectively (Table 3).
Table 3: Occupation of Caretakers
More than half (59.9%) of the respondent were being taken care of by their husbands, and more than a third (35%) by their parents. The others were taken care of by other relations as shown in (Table 4).
Table 4: Relationship of the Teenagers with their Caretakers
The Levels of Dietary Intake of the Pregnant Teenagers
Weekly Pattern of Dietary Intake
Staples (cereals, grains roots and tubers) were the highly
consumed food group with a mean weekly frequency
of consumption of 5.0 days. This was followed by fat
and oils and sugars which had their mean weekly frequency
of consumptions to be about 5 and 4 days respectively.
The least consumed food groups were vegetables
and fruits which both had equal mean weekly
frequency of consumption (2 days). This is further
shown in (Table 5).
Table 5: Descriptive Statistics for weekly food consumption and the Composite FCS
Levels of Food Intake
The mean composite FCS was 42.95. With respect to
the levels of food intake based on the composite FCS,
about half (51.7%) of respondents had acceptable levels
whiles 27.2% and 21.1% were borderline and poor
levels respectively (Figure 1).
Figure 1: Levels of food intake
The Dietary Quality of the Pregnant Teenagers
For the purpose of dietary diversity or quality, the
staples again appeared to be highly consumed with a
weekly mean of 6 days per week. Meats, pulses and
nuts, other vegetables, vitamin A rich vegetables, vitamin
A rich fruits and other fruits had comparable levels
of consumption with a weekly mean of 3 days. Fish
was the least consumed food group with a weekly
mean of 1 day. The details are presented in (Table 6).
Table 6: Descriptive Statistics for Dietary Diversity
Individual Dietary Diversity Scores (IDDS)
The mean IDDS was 10.0 with a standard. The
minimum IDD score of 7 was obtained by 10.2% of
respondents and the maximum IDD score of 12 was
obtained by 19.5% of respondents. Most of the respondents
(32.7%) had Individual Dietary Diversity
Scores of 11 (Figure 2)
Figure 2: Frequency of Individual Dietary Diversity Scores (IDDS)
The Relationship between Socio-Demographic
Characteristics and Dietary İntake
None of the socio-demographic variables of the teenagers
had any significant association with their dietary
intake (both the levels of food intake and IDDS.
Among all the socio-demographic variables of the
caretakers, their gender, relationship with the respondents
and occupation had significant associations with
the level of food intake. However, none of the variables
were associated with the IDDS.
Discussion
About half of the pregnant teenagers were in the third trimester of their pregnancy which could result from the fact that the study was carried out at ANC outlets where pregnant women in developing countries are known to normally book late11. The high proportion of those without education could be due to the fact that most of the respondents were coming from the surrounding rural communities in the metropolis where formal education is usually a challenge. This result is consistent with other studies that have reported the level of education to be negatively associated to the prevalence of teenage pregnancy11,15. About twothirds of respondents (64.2%) were married, which is also consistent with several research findings including the UNICEF-sponsored International Planned Parenthood Federation (IPPF) report on child marriage21.
As shown in Table 1, many of the caretakers were between their late 20s to early 30s and were mostly males (83.7%) because most of the teenagers were married and were living with their husbands. Again, many of the caretakers (70.3%) had no education which further confirms the findings that education of the spouses and not only that of the teenager could have a negative effect on the occurrence of teenage pregnancies since those who are not in school tend to marry earlier than their literate counterparts22. Almost all the caretakers (87.0%) were in informal employment (Table 3).
Dietary Intake of the Pregnant Teenagers
Among all the eight food groups, which were used to
estimate the levels of food intake with the Food Consumption
Scores (FCS), staples (cereal grains, roots
and tubers) were the highly consumed food group with
a mean weekly frequency of 6 days. This was followed
by Fats and sugars, with 5 and 4 days per week respectively
as their mean weekly frequencies of intake, were
the next mostly consumed food groups. The least consumed
food groups were vegetables and fruits (Table
5). This pattern is consistent with dietary patterns of
populations in developing countries which are mainly
composed of staples and energy dense food groups
(fats and oil) and a limited quantity of animal products
and fresh fruits and vegetables23,24. This presents
a risk of deficiencies or excesses of several micro or
macronutrients25. The low consumption of fruits and
vegetables as well as meat and fish presents a nutritional
concern especially with respect to micronutrient
adequacy of their diet, as these nutrients are essential
during pregnancy especially among teenagers.
The mean Composite Food Consumption Score (CFCS) was 42.9, which is at the extreme lower end for the acceptable level of intake. Despite this lower mean CFCS, about half of the teenagers (51.7%) had an acceptable level of food intake based on the FAO/WFP CFCS thresholds. Not much difference was observed in the proportions at borderline (27.2%) and unacceptable (21.1%) levels of food intake (Figure 1).
Dietary Quality of the Pregnant Teenagers
With regard to the quality of diet which was measured
with the IDDS, it was observed that out of a total of 12
food groups, the respondents consumed averagely from
10 different food groups (Table 6). This means that
generally the respondents had good quality diet because
previous studies have reported dietary diversity
as an important element of a high quality diet26,27. They therefore have a greater probability of meeting
their energy and micronutrient requirements as Dietary
Diversity Score have been reported by many studies to
be correlated positively with energy and micronutrient
intake28-32.
The Effects of the Socio-Demographic and Economic
Factors on the Dietary Intake
Among all the socio-demographic variables of the
teenagers, none except the term of their pregnancies,
had significant associations with their level of food
intake (Figure 2 and Table 7). This association could
be explained by the fact that these teenagers are mainly
dependent on their caretakers and as such obtained
their food from them. Those in their second trimester
had highest proportion of those with acceptable intake.
This could be due to the aversions and other non-diet
friendly symptoms of early pregnancy such as nausea
and appetite loss that often affect food intake during
the first trimester33. Also, within this period, the
teenager is still in a transition from her normal life to
life during pregnancy and as such the nutritional support
offered to her due to the pregnancy is yet to start11,34,35.
Table 7: Significant associations of some socio-demographic variables with level of food intake
The significant associations observed between gender of the caretakers and their relationship with the respondents (Table 7) could be due to the fact most of them were married and thus were staying with their husbands. Occupational status that was used as a measure of economic status of the caretakers was also significantly associated with levels of food intake. This is consistent with the age-old literature that occupation is associated positively with economic food acquisition or accessibility of households or individuals36,37.
Even though the overall food consumption and dietary diversity or quality of the pregnant teenagers was acceptably high, a considerable proportion still fell within both the poor and borderline food consumption categories intake. The food consumption was observed to be significantly associated with the caretakers sociodemographic factors such as gender, relationship with the teenager and occupation.
These findings highlight the need consider the caretakers or spouses of pregnant teenagers in designing intervention programs and policies to improve the dietary intake of pregnant teenagers for the improvement and maintenance of their nutritional status during and after pregnancy. These programs and policies will go a long way to reduce the contribution of teenage pregnancy on maternal and infant mortalities and morbidities in the metropolis and the country and beyond.
References
1)Aboyeji AP. Obstetric outcome of teenage primigravidae
2)in Ilorin. Niger Med J 1997; 33: 56-9.
3)Ademuyiwa MO, Sanni SA. Consumption pattern
4)and dietary practices of pregnant women in Odeda
5)Local Government Area of Ogun State. Int J Biol
6)Vet Agric Food Eng 2013; 7: 1049-53.
7)Allen L. To what extent can food-based approaches
8)improve micronutrient status? Asia Pac J Clin
9)Nutr 2008; 17: 103-5.
10)Arimond M, Wiesmann D, Becquey E, et al. Simple
11)food group diversity indicators predict micronutrient
12)adequacy of womens diets in 5 diverse,
13)resource-poor settings. J Nutr 2010; 140: 2059-69.
14)Boyd A. The World's Youth 2000. Population
15)Reference. Bureau; Washington DC: Measure
16)Communications, 1999.
17)Christina CL, Grace KL, Linda SL, James HL.
18)Pregnancy hormone metabolite patterns, pregnancy
19)symptoms, and coffee consumption; Am J Epidemiol
20)2002; 156: 428-37.
21)Dina L. Dietary Diversity and Nutrient Adequacy
22)in Women of Childbearing Age in a Senegalese
23)Peri-urban Community. School of Dietetics and
24)Human Nutrition, McGill University, Montreal,
25)Canada. 2004.
26)FAO. Guidelines for Measuring Household and
27)Individual Dietary Diversity. Food and Agriculture
28)Organization of the United Nations, Rome, Italy,
29)2011.
30)Ghana Statistical Service (GSS). Ghana Health
31)Service (GHS) and ICF Macro. Ghana Demographic
32)and Health Survey 2008. Accra, Ghana:
33)GSS, GHS, and ICF Macro 2009; FR221; 147-78.
34)Gina K, Maylis R, Terri B, Marie CD. Measurement
35)of Dietary Diversity for Monitoring the Impact
36)of Food Based Approaches; Produced as Part
37)of the Published Proceedings of the International
38)Symposium on Food and Nutrition Security: Food-
39)Based Approaches for Improving Diets and Raising
40)Levels of Nutrition. Rome, Italy 2010.
41)Gross K, Alba S, Glass TR, Schellenberg JA,
42)Obrist B. Timing of antenatal care for adolescent
43)and adult pregnant women in south-eastern Tanzania.
44)BMC Pregnancy Childbirth 2012; 12: 6.
45)Konttinen H, Sarlio-Lähteenkorva S, Silventoinen
46)K, Männistö S, Haukkala A. Socio-economic disparities
47)in the consumption of vegetables, fruit and
48)energy-dense foods: the role of motive priorities.
49)Public Health Nutr 2013; 16: 873-82.
50)Hatloy A, Torheim L, Oshaug A. Food variety-a
51)good indicator of nutritional adequacy of the diet?
52)A case study from an urban area in Mali, West Africa.
53)Eur J Clin Nutr 1998; 52: 891-8.
54)Hoddinott J, Yohannes Y. Dietary diversity as a
55)food security indicator. Food and Nutrition Technical
56)Assistance Project (FANTA). Washington,
57)D.C: Academy for Educational Development,
58)2002.
59)International Planned Parenthood Federation and
60)Global Coalition on Women and AIDS. Ending
61)Child Marriage: A Guide for Global Policy Action
62)2007. London: Portfolio Publishing, 2007.
63)Johns T. Plant biodiversity and malnutrition: Simple
64)solutions to complex problems. Afr J Food Agr
65)Nutr Dev 2003; 3: 45-52.
66)Jyothilakshmi A, Prakash J. Maternal characteristics
67)and nutritional and health status of rural children;
68)an overview. Ind J Nutr Diet 2004; 41: 30-7.
69)Khanna S, Chand S, Singla PN, Agarwal KN.
70)Morphological study of placenta in pregnancy
71)anemia. Ind J Pathol Microbiol 1979; 22: 7-12.
72)Madeline Z. The effect of partners characteristics
73)on teenage pregnancy and its resolution. Fam
74)Plann Perspect 2001; 33: 192-9.
75)Magadi MA, Agwanda AO, Obare FO. A comparative
76)analysis of the use of maternal health services
77)between teenagers and older mothers in sub-
78)Saharan Africa: evidence from Demographic and
79)Health Surveys (DHS) 2006. Soc Sci Med 2007;
80)64: 1311-25.
81)Mirmiran P, Azadbakht L, Azizi F. Dietary diversity
82)among food groups: an indicator of specific nutrient
83)adequacy in Tehranian women. J Am Coll
84)Nutr 2006; 25: 354-61.
85)Mirmiran P, Azadbakht L, Esmaillzadeh A, Azizi
86)F. Dietary diversity score in adolescents- a good
87)indicator of the nutritional adequacy of diets: Tehran
88)lipid and glucose study. Asia Pac J Clin Nutr
89)2004; 13: 56-60.
90)Ojengbede OA, Otolorin EO, Fabanwo AO. Pregnancy
91)performance of Nigerian women aged 16
92)years and below. Afr J Med Sci 1987; 16: 89-95.
93)Okpani AOU, Ikimalo J, John CT and Briggs ND.
94)Teenage Pregnancy. Trop J Obstet Gynaecol 1995;
95)12: 34-6.
96)Roy S, Motghare DD, Ferreira AM, Vaz FS, Kulkarni
97)MS. Maternal determinants of low birthweight
98)at a tertiary care hospital. J Fam Welfare;
99)2009; 55: 79-83.
100)Steyn NP, Nel JH, Nantel G, Kennedy G, Labadarios
101)D. Food variety and dietary diversity scores in
102)children: are they good indicators of dietary adequacy?
103)Public Health Nutr 2006; 9: 644-50.
104)Tontisirin K, Nantel G and Bhattacharjee L. Foodbased
105)strategies to meet the challenges of micronutrient
106)malnutrition in the developing world. Proc
107)Nutr Soc 2002; 61: 243-50.
108)Tucker K. Eat a variety of healthful foods: old
109)advice with new support. Nutr Rev 2001; 59; 156-8.
110)United Nations Childrens Fund (UNICEF). Strategies
111)of improving nutrition of children and women
112)in developing countries; New York: UNICEF,
113)1990.
114)United Nations Population Fund. Fast Sheet:
115)Young people and Demographic Trends. New
116)York: UNFPA 2000.
117)Uwaezuoke IO, Uzochukwu SC, Nwagbo FE,
118)Onwujekwe OE. Determinants of Teenage Pregnancy
119)in Rural Communities of Abia State, South
120)East Nigeria. J Coll Med 2004; 9: 28-33.
121)WFP. Ghana Food Security and Vulnerability
122)Analysis; United Nations, WFP Headquarters, via
123)C.G. Viola 68, Parco de Medici, 00148, Rome, Italy
124)2012.
125)WFP and FAO. Measures of Food Consumption -
126)Harmonizing Methodologies; Interagency Workshop
127)Report; Rome, 2008.
128)WHO. Physical status: the use and interpretation of
129)anthropometry. Report of a WHO Expert Committee.
130)Technical Report Series No.854. Geneva,
131)1995: 460.
132)WHO. Adolescent Pregnancy (Issues in Adolescent
133)Health and Development). WHO Discussion
134)Papers On Adolescence; Department of Child and
135)Adolescent Health and Development. Geneva.
136)World Health Organization, 2004.
137)World Food Program. Comprehensive Food Security
138)& Vulnerability Analysis Guidelines. Rome:
139)United Nations World Food Program, 2009
© 2017 Fırat Tıp Dergisi. All rights reserved.